Introduction
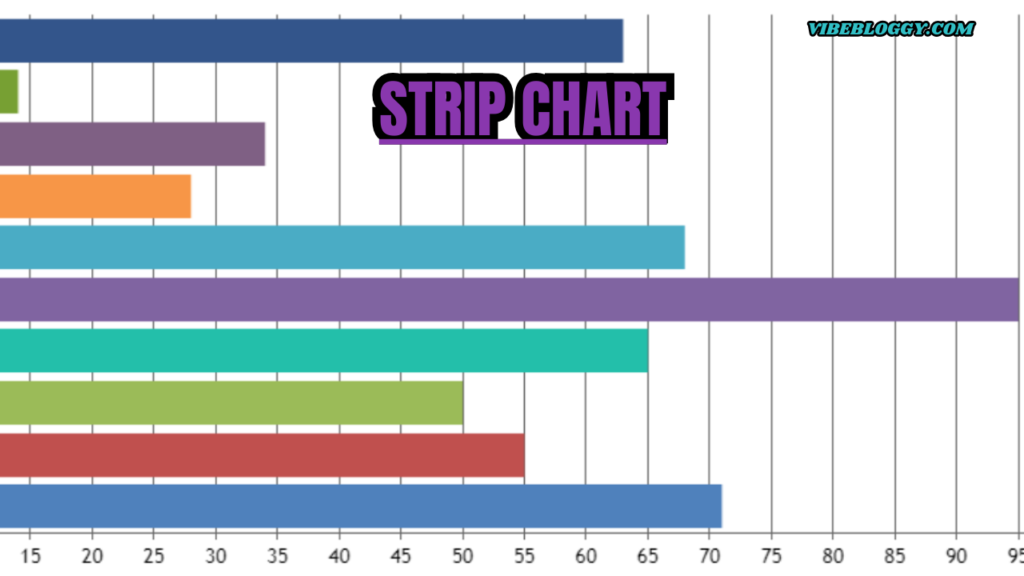
A strip chart is a graphical representation used to display data points over time on a continuous medium, typically paper or digital format. It features a single axis where multiple data series can be plotted, allowing for the visualization of trends and patterns in time-series data. Strip charts are particularly useful for monitoring processes in real-time, as they can depict changes in measurements from sensors or other data sources continuously. They are often employed in various fields, including engineering, environmental monitoring, and healthcare, to track variables such as temperature, pressure, or flow rates over time, facilitating quick analysis and decision-making .
What is a Strip Chart?
A strip chart refers to a type of graph or visual representation that records data in real-time, typically on a paper or digital medium. It captures changing variables over time, with data points displayed along a horizontal axis (time) and the measured values on the vertical axis.
Strip charts present information continuously, making them ideal for tracking patterns, identifying trends, and detecting anomalies in various processes.
Originally, strip charts relied on paper and ink to plot data points manually. Modern strip charts, however, often use digital technology for improved accuracy and ease of data storage. Whether digital or analog, strip charts offer a clear, straightforward way to visualize data, ensuring that essential information remains accessible and understandable.
History of the Strip Chart Recorder
The concept of strip chart recorders emerged during the industrial revolution when monitoring machinery and processes became crucial for maintaining efficiency and safety. Early versions of strip charts were fully mechanical, using paper rolls and ink pens to record data over time. These devices typically measured temperature, pressure, and electrical currents in factories and power plants.
With the rise of computers and digital technology, strip chart recorders evolved significantly. Digital strip charts now offer precise data collection, enhanced visualization capabilities, and storage options that eliminate the need for bulky paper rolls. Despite these advancements, the fundamental purpose of strip charts has remained the same—tracking changes over time to inform decision-making and optimize performance.
How Does a Strip Chart Work?
A strip chart works by recording data continuously along a moving axis, typically representing time. Here’s a simplified breakdown of how a strip chart operates:
- Data Collection: The system continuously collects data from sensors, inputs, or external devices. For instance, in industrial applications, sensors might measure temperature, humidity, pressure, or voltage levels.
- Recording Mechanism: The strip chart uses a recording mechanism, such as a pen and ink on paper or a digital display, to plot the data. The chart’s horizontal axis represents time, while the vertical axis reflects the changing data values.
- Data Display: As time passes, the strip chart creates a visual representation of the recorded data. This display enables users to see real-time changes, detect patterns, and assess the stability of the system being monitored.
- Data Storage: Analog strip charts often store data on paper, while digital versions log data in files, allowing users to review it later for analysis or troubleshooting.
By continuously plotting real-time data, a strip chart ensures users can monitor trends, react to abnormalities promptly, and maintain control over the processes being tracked.
Types of Strip Charts
Strip charts come in various forms, each designed to meet specific data monitoring needs. Below are the primary types of strip charts:
Single-Channel Strip Chart Recorder
A single-channel strip chart recorder monitors only one variable at a time. It records data continuously from a single source, such as temperature or pressure. These recorders are ideal for simple monitoring tasks where only one factor needs tracking over time.
Multi-Channel Strip Chart Recorder
Multi-channel strip chart recorders track multiple variables simultaneously. For example, they might record temperature, pressure, and humidity in an industrial setting. Multi-channel recorders display each variable on separate tracks within the same chart, allowing users to compare trends across different data sets in real-time.
Analog Strip Chart Recorder
An analog strip chart recorder relies on mechanical components, such as pens and paper rolls, to record data. These recorders were widely used before digital technology became mainstream. Though they have been largely replaced by digital systems, some industries still use analog strip charts for specific applications that require hard-copy data records.
Digital Strip Chart Recorder
Digital strip chart recorders use electronic sensors and software to collect, display, and store data. The charts are displayed on screens rather than paper, and the data can be saved for future reference. Digital recorders offer greater precision, flexibility, and ease of use compared to their analog counterparts.
Hybrid Strip Chart Recorder
Hybrid strip chart recorders combine elements of both analog and digital systems. They offer digital displays for real-time monitoring but still provide the option to print data onto paper for permanent records. This type of recorder serves industries where both digital and paper records are required for compliance or auditing purposes.
Advantages of Using Strip Charts
Strip charts offer numerous advantages, particularly for professionals who require real-time monitoring of continuous data. Here are the key benefits of using strip charts:
Real-Time Data Visualization
One of the most significant advantages of strip charts is their ability to provide real-time data visualization. As data points get plotted continuously, users can see changes happening in real-time, allowing them to respond quickly to any deviations or abnormalities.
Easy Trend Identification
Because strip charts continuously plot data over time, they make it easy to identify trends and patterns. For instance, a manufacturing plant manager can easily spot gradual increases in temperature that may indicate an equipment malfunction.
Accurate and Continuous Data Recording
Strip charts provide continuous data without gaps, ensuring no information is missed during the monitoring process. This capability is crucial in situations where every data point matters, such as in medical diagnostics or industrial safety systems.
Multiple Channels for Comprehensive Monitoring
Multi-channel strip charts allow users to track several variables at once, providing a holistic view of a system’s performance. This is particularly useful in complex environments where multiple factors affect overall performance, such as in power plants or research laboratories.
Durability and Reliability
Analog strip chart recorders are known for their durability and reliability. These devices require minimal maintenance and provide accurate readings over long periods, making them ideal for harsh environments or applications that demand a physical data record.
Applications of Strip Charts Across Industries
Strip charts play an essential role in many industries, from manufacturing and healthcare to research and environmental monitoring. Below are some common applications of strip charts:
Industrial Monitoring
In industrial settings, strip charts help monitor crucial variables such as temperature, pressure, and humidity. For example, power plants use strip charts to monitor turbine performance and ensure safety regulations are met. In manufacturing, strip charts track production variables, helping detect equipment malfunctions before they lead to costly downtime.
Healthcare and Medical Diagnostics
Strip charts serve a vital function in medical diagnostics, especially in the form of electrocardiograms (ECGs) and electroencephalograms (EEGs). These charts record electrical activity in the heart and brain, respectively, allowing healthcare professionals to diagnose medical conditions such as arrhythmias, epilepsy, or heart disease.
In hospitals, strip charts monitor patients’ vital signs, providing real-time data that can alert medical staff to potential health crises, ensuring timely interventions.
Environmental Monitoring
Strip charts are essential for environmental monitoring, tracking variables such as air quality, water levels, and weather patterns. Government agencies and researchers use these charts to collect and analyze data that helps in the prediction of natural disasters or the assessment of environmental impact.
For instance, strip charts can continuously monitor pollutant levels in water bodies or detect trends in atmospheric pressure, helping meteorologists forecast storms and other weather phenomena.
Research Laboratories
Strip charts play a critical role in scientific research. Researchers use them to monitor experimental conditions over time, ensuring accuracy and consistency in their results. In biology or chemistry laboratories, for instance, strip charts track temperature, pH levels, or chemical concentrations during long-running experiments.
Energy and Utilities
In the energy sector, strip charts help monitor electrical grids and track energy consumption. Power plants rely on these charts to observe equipment performance, ensure operational efficiency, and prevent malfunctions. By visualizing data trends in real-time, strip charts enable engineers to manage energy production and distribution effectively.
How to Choose the Right Strip Chart Recorder
Selecting the right strip chart recorder depends on the specific needs of your application. Here are some factors to consider when choosing a strip chart:
Number of Channels
Determine how many variables you need to monitor simultaneously. Single-channel recorders may be sufficient for simple tasks, but multi-channel recorders are essential for complex applications where multiple factors require continuous tracking.
Analog vs. Digital
Consider whether you need an analog or digital recorder. Analog recorders are more durable and provide physical paper records, which may be required in certain industries. However, digital recorders offer greater flexibility, precision, and storage capacity, making them a better choice for most modern applications.
Recording Speed
Check the recording speed of the strip chart recorder, especially if your application involves fast-changing data. A recorder with a high-speed setting will capture rapid changes accurately, ensuring that you don’t miss critical information.
Data Storage and Review Options
If you require long-term data storage and easy access for review, a digital strip chart recorder with integrated storage capabilities will be the best option. These recorders allow you to save data electronically, making it easier to retrieve and analyze later.
Environment and Durability
Ensure that the strip chart recorder you choose can withstand the environmental conditions of your industry. For instance, if you work in a factory or power plant, you’ll need a durable recorder that can handle high temperatures, dust, or humidity without compromising accuracy.
Future of Strip Chart Technology
While strip charts have evolved significantly, their future holds even more potential. With advancements in artificial intelligence (AI) and machine learning, strip chart technology could integrate predictive analytics, allowing users to anticipate system failures or inefficiencies before they occur.
Moreover, the growing demand for real-time data monitoring across industries will continue to drive innovation in strip chart design. We can expect to see smaller, more efficient devices that offer better connectivity and seamless integration with other monitoring systems.
Conclusion
Strip charts provide an indispensable tool for professionals who require continuous, real-time data monitoring. From industrial environments to medical diagnostics and research laboratories, strip charts help ensure that systems operate efficiently, safely, and within established parameters. With the advancements in digital technology, strip charts will continue to evolve, offering greater precision and flexibility in data visualization and recording.
Also Read: Andywarhella : The Life and Legacy , Iconic Artist.
FAQs
What is a strip chart used for?
A strip chart is used to record and display continuous data trends over time, making it useful for real-time monitoring and detecting patterns or anomalies in various applications.
How does a strip chart work?
A strip chart collects data from sensors and records it on a moving axis, with time represented on the horizontal axis and the measured values on the vertical axis.
What are the types of strip charts?
Common types of strip charts include single-channel, multi-channel, analog, digital, and hybrid recorders, each designed for specific data monitoring needs.
Where are strip charts used?
Strip charts are used in industries such as manufacturing, healthcare, environmental monitoring, research laboratories, and energy utilities to track real-time data and ensure system efficiency.
What is the difference between analog and digital strip charts?
Analog strip charts use paper and ink to record data, while digital strip charts use electronic displays and software to plot data. Digital charts offer more flexibility and accuracy but lack physical hard copies.
How do you choose the right strip chart recorder?
Consider factors like the number of channels, analog vs. digital options, recording speed, data storage needs, and the environmental conditions in which the recorder will operate.


